Getting Started
Filters
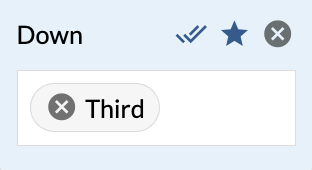
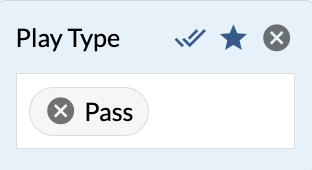
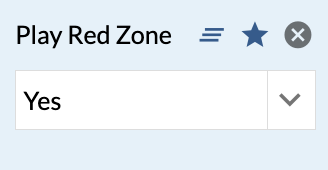
Filters allow you to narrow the focus of your research and answer granular questions about player and team performance. For example, imagine you are trying to answer these three questions:
How does a player perform against man coverage?
What about in a particular down and distance?
Does it make a difference if that down and distance is in the red zone?
Each of these questions is answered by applying a new filter.
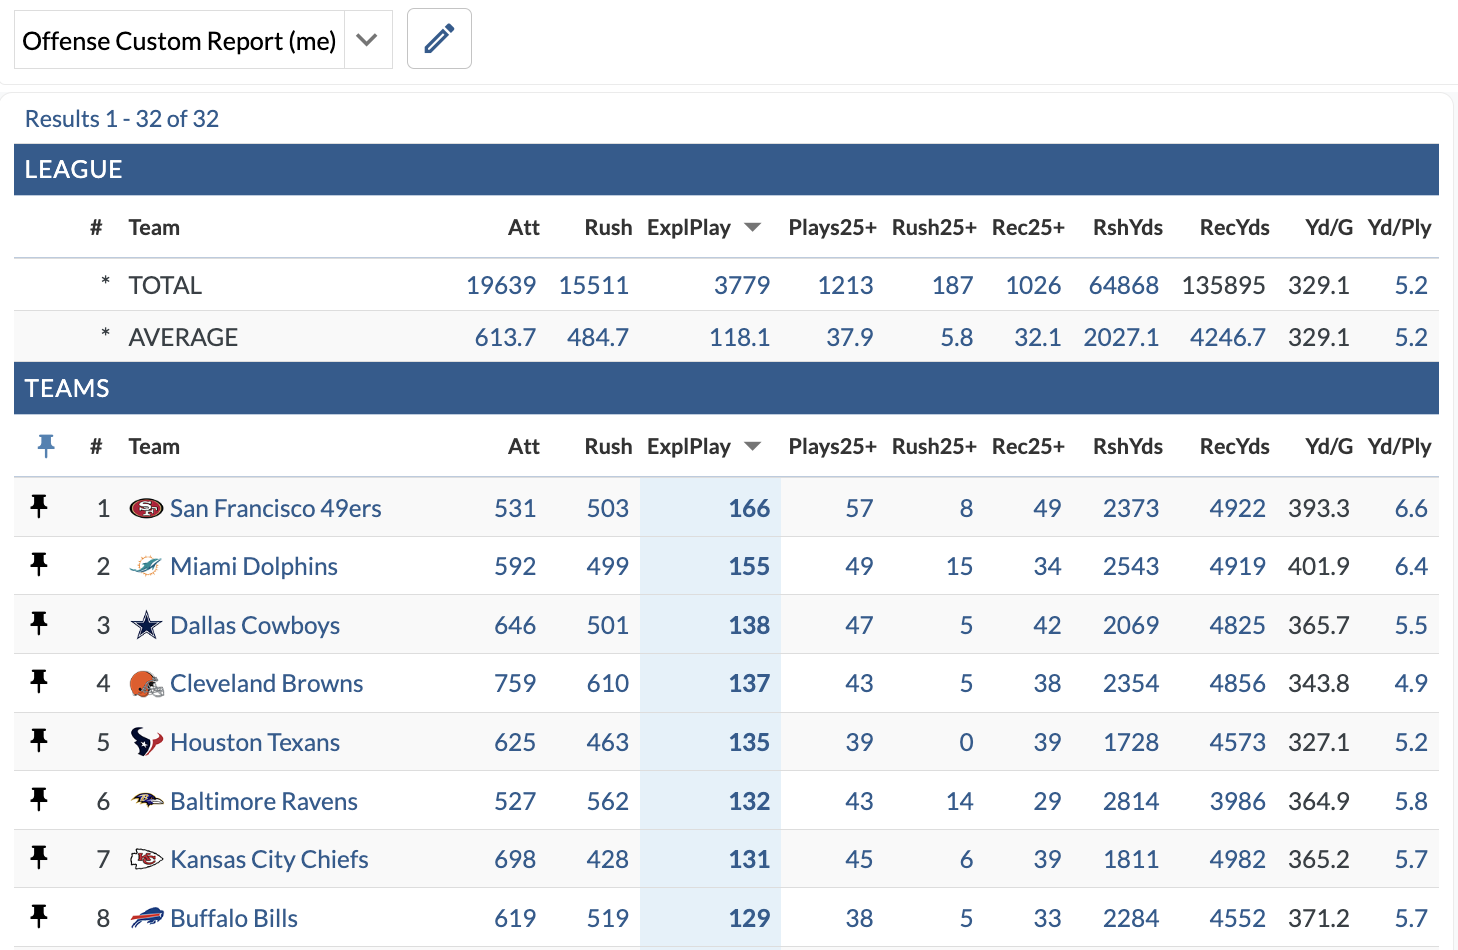
Custom Reports
A report is a saved group of stats and there are two types of reports:
Native Reports - generic reports provided by TruMedia.
Custom Reports - reports that you create.
The Custom Reports Builder allows you to create new reports that with certain stats.
These reports are available everywhere on TruMedia including leaderboards, individual team and player pages, and Custom Pages.
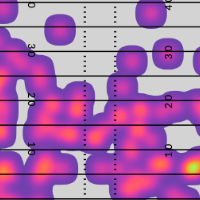
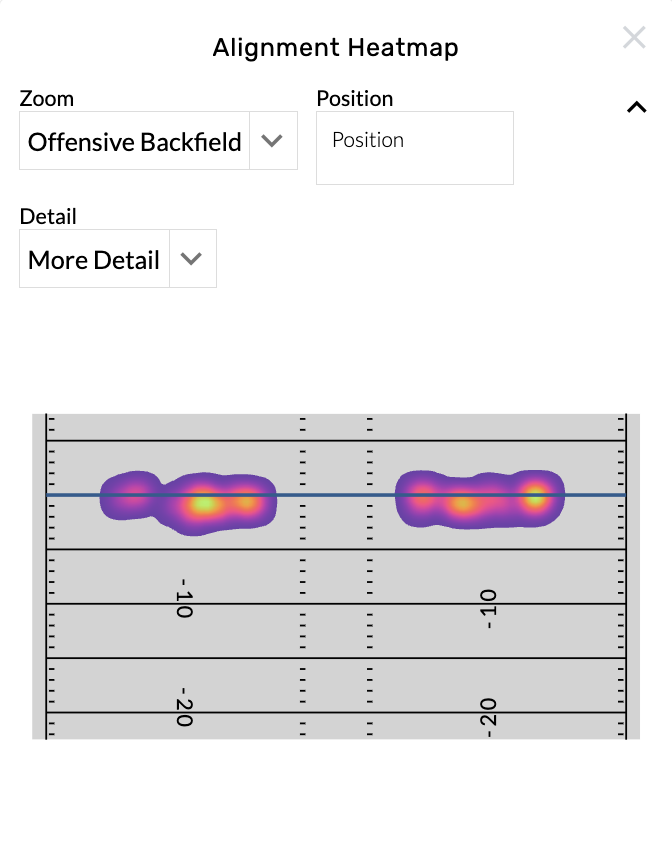
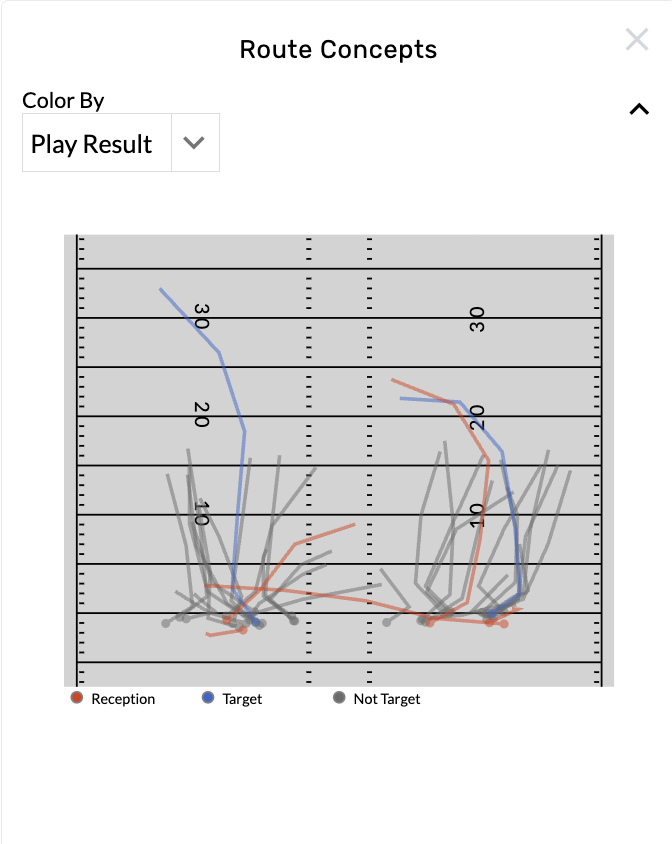
Graphics
These are available on individual team or player pages to help simplify data into digestible insights. Each graphic has flexible custom settings and most are connected to video by clicking on an event in the graphic.
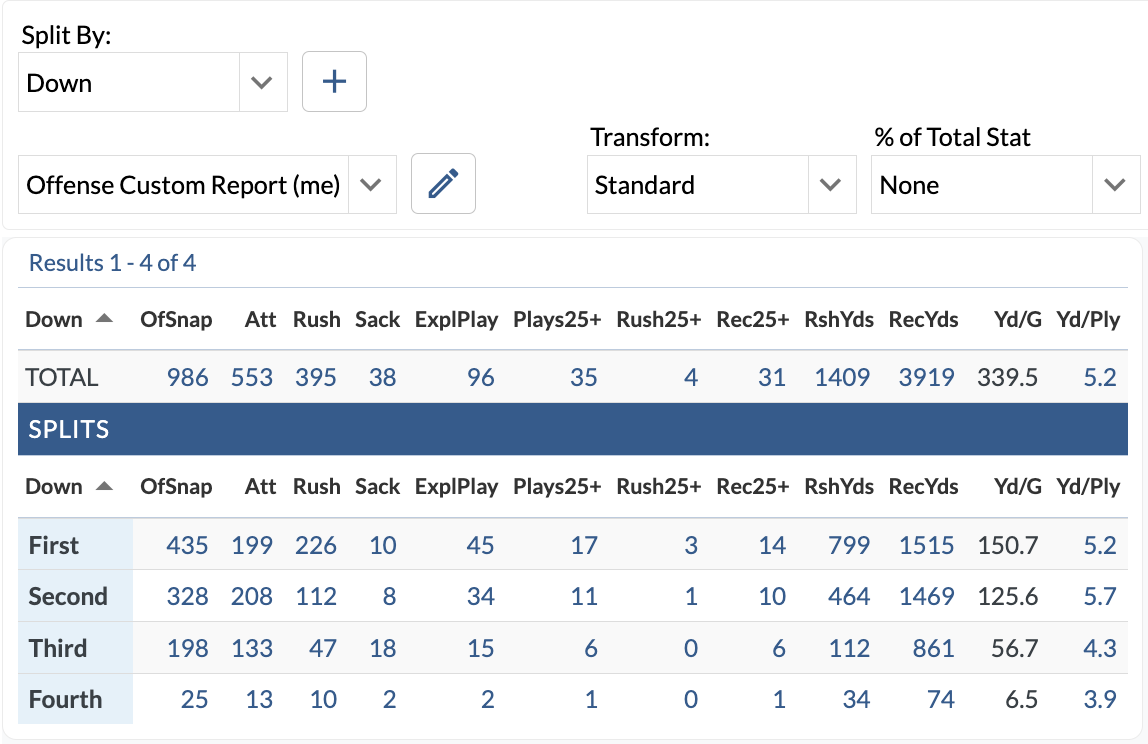
Splits Table
These tables are available on individual team or player overview pages and allow you to view the splits on any report. Combined with filters and graphics, this tool helps tell a more complete story of player and team performance.